
Which Emotion Is Currently Driving the Market
TL;DR
The fear and greed index provides a metric for investor sentiment, suggests which prevailing emotion is currently driving the market and you can use it to find opportunities.
Last week was a good one for the markets. All three major indices closed at all-time highs:
- The Dow surpassed 40k for the first time.
- The S&P 500 set its all-time high for the 23rd time in 2024, surpassing 5,300 for the first time.
- And the Nasdaq set a new best at 16,742.
For some prognosticators, past ramblings didn’t age so well:
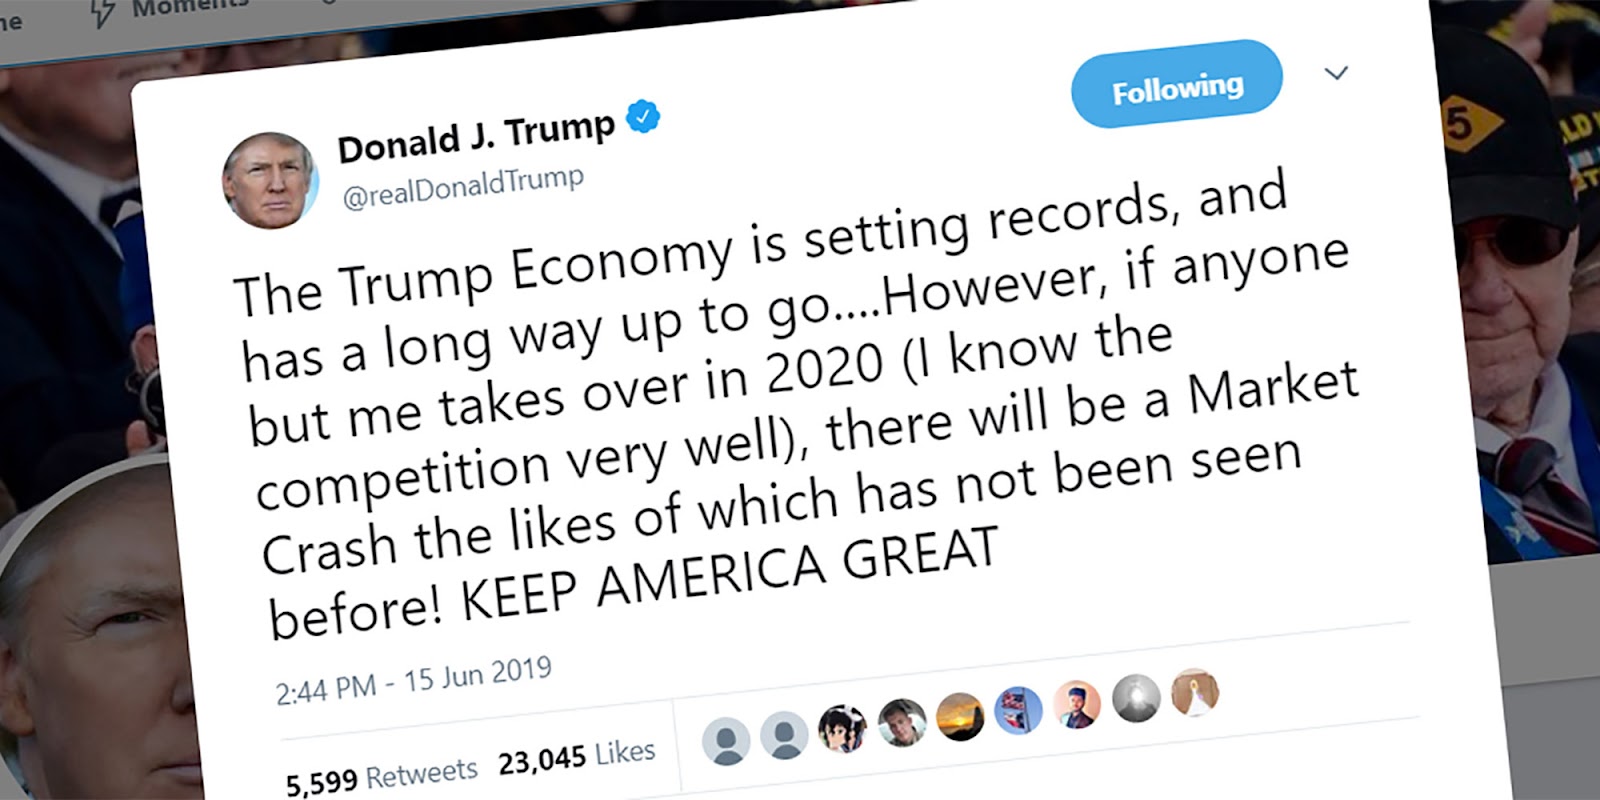
Not only has there been no “market crash the likes of which has not been seen before” … investors have been pretty happy checking their portfolio statements lately.
While the former president famously fuels his base by dispensing unfounded fears, he’s hardly a barometer of market sentiment.
For that, we have …
The Fear & Greed Index
The index provides a way to assess market momentum and determine if stocks are fairly priced:
- With excessive fear, prices tend to be driven downward.
- With excessive greed, prices tend to be pushed upward.
And since the market’s one-year low in October 2023, the index has been showing that investor sentiment is leaning towards greed:
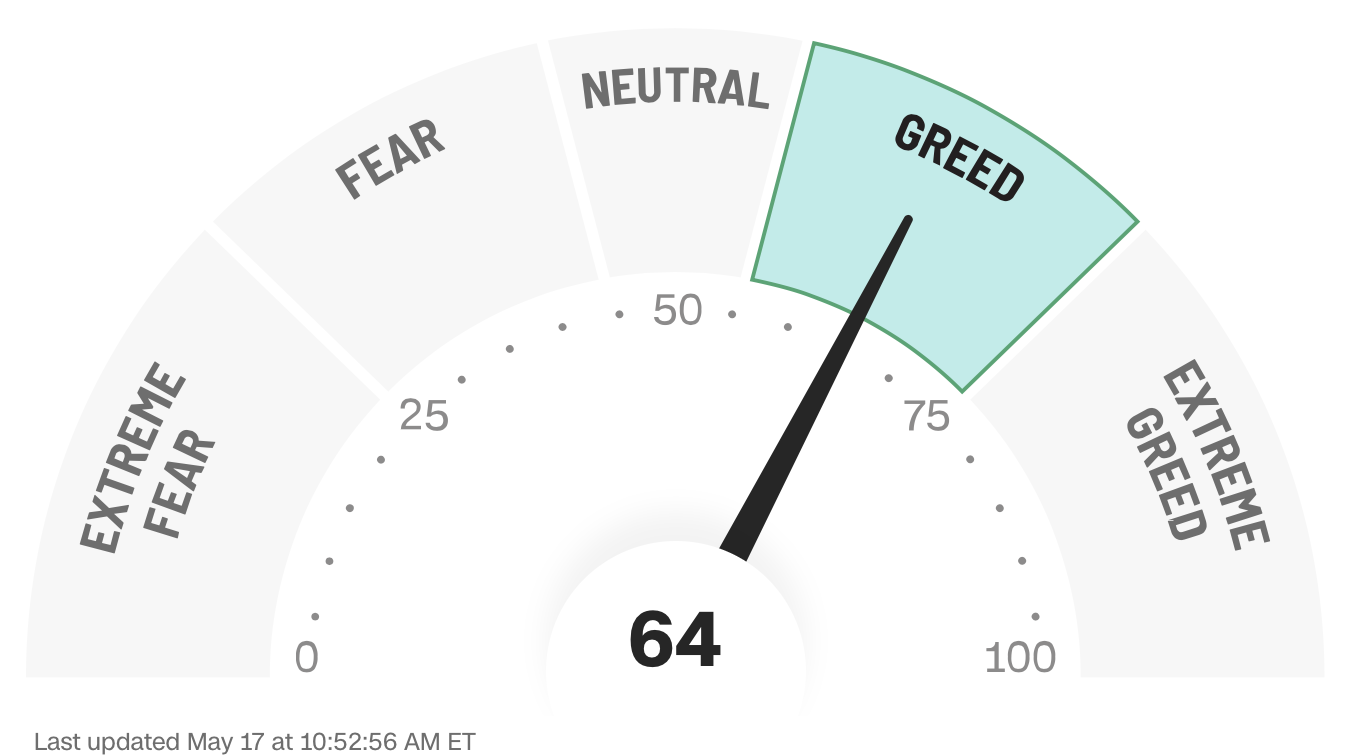
But lately, that greed’s been increasing. Why?
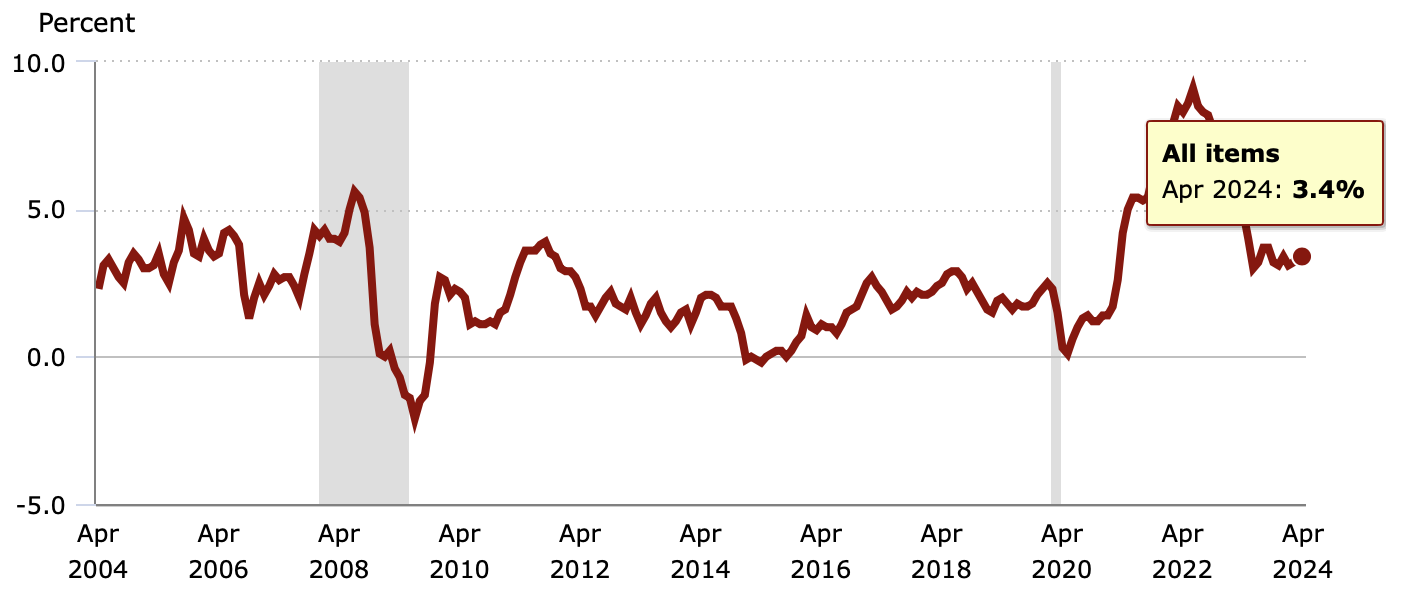
- Inflation & rate cuts: Last week’s Consumer Price Index report marked a three-year low, leading many to believe the Fed will finally begin rate-cutting in September.
- Riskier assets inflows: Bitcoin hit a three-week high last week and is up 15% since May 1. For options, calls (bullish) have outnumbered puts (bearish) 1.2 to 1 this month, and the short-lived return of meme stocks provided another example of investors’ demonstrating more risk appetite.
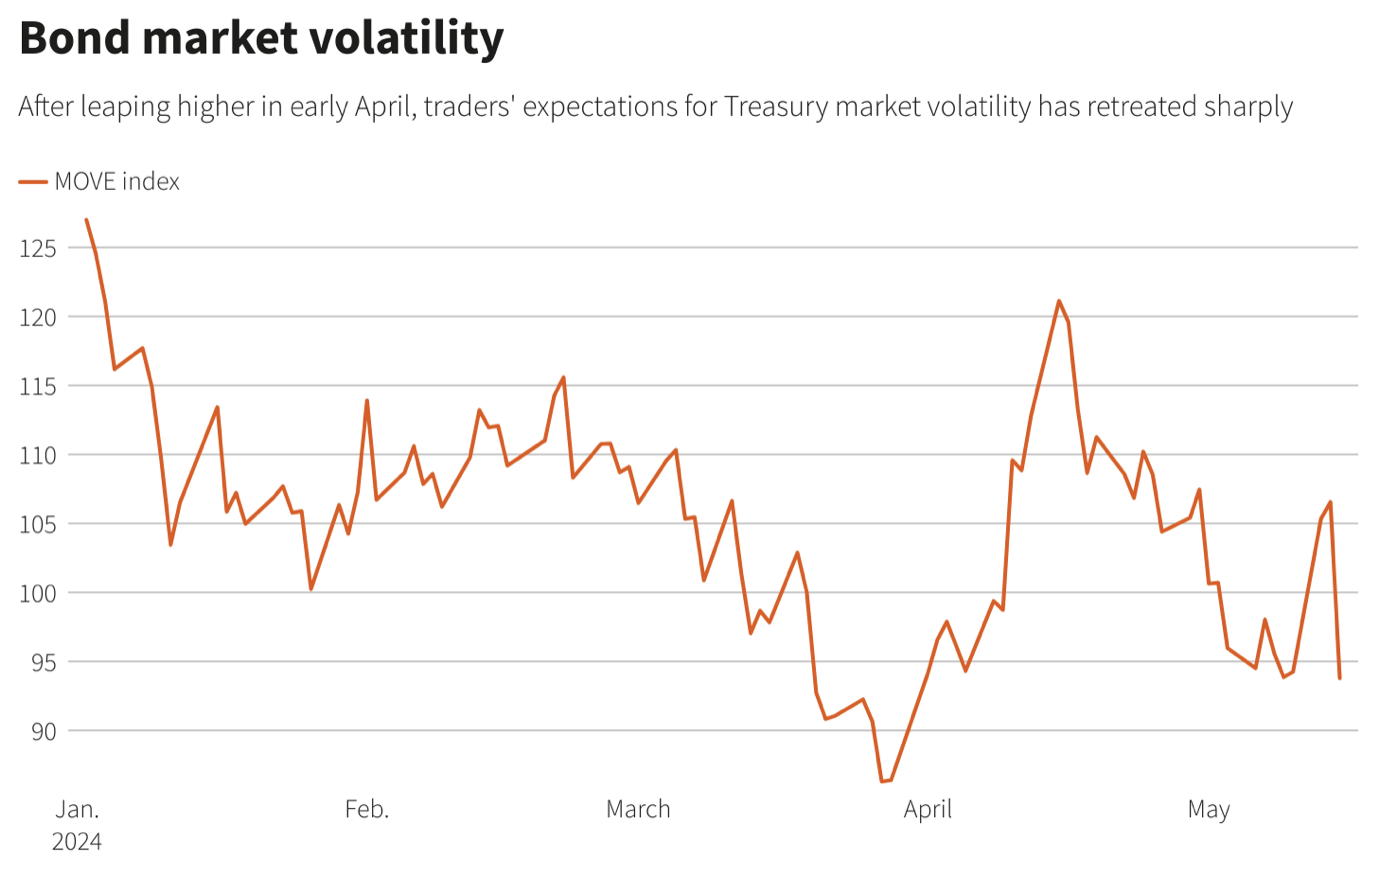
- Reduced bond market volatility: Bond prices have stabilized, suggesting increased confidence in the Fed’s looming rate-cut decision and a lower reliance upon safe-haven assets.
How It Works
The fear and greed index operates on a 0–100 scale. Extreme fear and fear are indicative of investor pessimism, and greed and extreme greed are indicative of optimism.
When the scale is lower than 50, it could suggest stocks are oversold (which could hint at a looming reversal).
Conversely, when the scale reads above 50, there are concerns that stocks are overbought (which could hint at a looming selloff).
Because the index is influenced by market trends (e.g., cycles and seasonality), economic conditions, geopolitics and more, the gauge itself is irrelevant unless combined with other indicators … like moving averages.
How to Use It
When the fear and greed index is used vis-à-vis an indicator like the 125-day moving average, it provides insight into the general direction of the market:
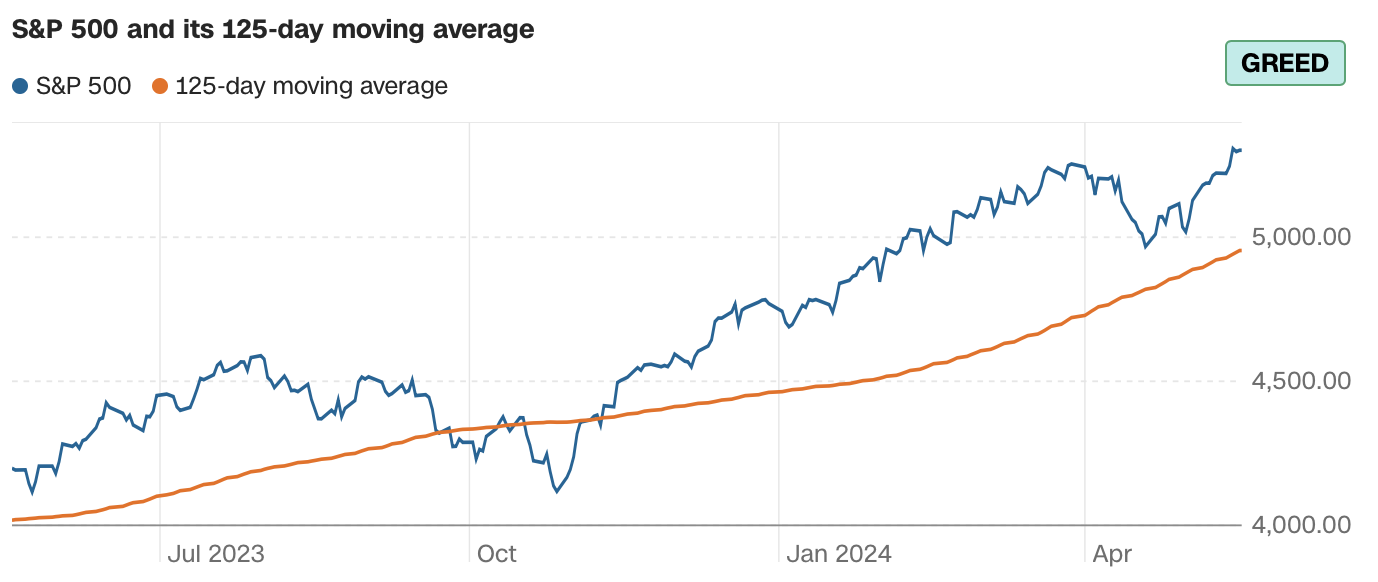
By using the 125-day moving average as a supplemental indicator, the index can demonstrate how sustainable a market trend is and when investors could expect a selloff or rally (and hence, selling and buying opportunities).
Importantly, the fear and greed index alone shouldn’t be used to make investing decisions but rather as a supplement (along with technical and fundamental analysis) to factor in that decision-making process. It is a measure of sentiment and doesn’t imply likely long-term success or failure.
However, for traders with shorter horizons, it can be useful in identifying those aforementioned selling and buying opportunities.
The COVID Example
When COVID-19 arrived in the U.S., the index suggested extreme fear and its reading bottomed out at 8. The market began selling off (with well-informed politicians leading the way) and the S&P 500 fell 32% between Valentine’s Day and March 20, 2020.
But the short-lived COVID-induced recession officially only lasted two months. By May 2020, the S&P 500 was steadily recovering, and by August 2020, it was higher than before the pandemic began.
Taking that example one step further, when the S&P 500 went on a 107% run from March 2020 to February 2022, the fear and greed index reading reached 82 (or extreme greed). Then, the market began to sell off, shedding 25% before bottoming in October 2022.
So, can you use the fear and greed index to time trades? Yes.
Should you use it by itself? No. Is it really good at letting investors know when the sh*t’s about to hit the fan? Absolutely.
