
An All-in-One Big Tech Investment
Tech had a big year in 2023, and for loyalists, it was rewarding after 2022’s portfolio-obliterating losses.
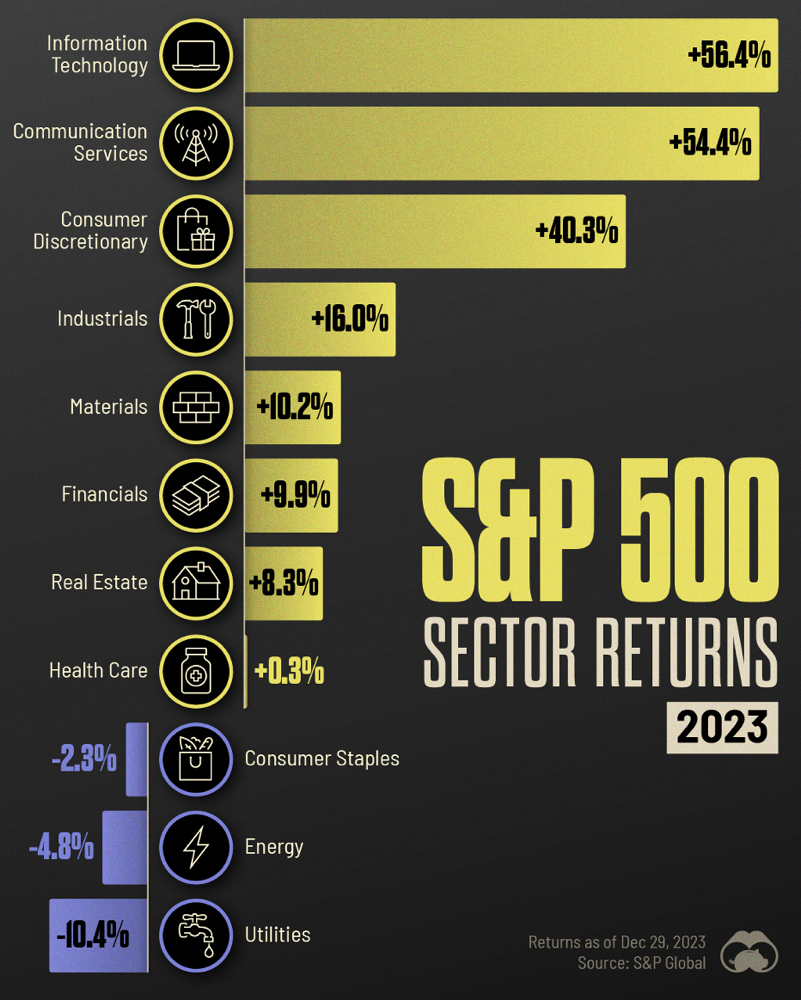
Of the 11 S&P 500 sectors, tech led the way with a 56.4% gain. Not bad considering the year prior, it dropped 28.19%.
For perspective, that 56.4% was the best year for tech finishing atop all 11 sectors in over a decade, even when it did so three times from 2017–2020 with gains of 38.83% (2017), 50.29% (2019) and 43.89% (2020). You’d have to go back to 2009 for the last time it had a more successful year when it posted a 61.72% gain.
Given how often we write about conservative personal finance topics — like dividend reinvestment, consumer staple stocks and safety-focused CDs and high-yield savings accounts — an issue about tech investing may seem uncharacteristic.
But today, we’re focusing on an approach that provides lower downside risk than picking and choosing individual tech stocks … and at much more accessible price points.
Big Tech’s Big Momentum
While some might expect tech to “correct” this year, that doesn’t seem to be in the cards. Looking back at its run between 2017–2020, it outgained all sectors thrice. Now, bolstered by the advent of AI and ongoing industry consolidation, we (and financial analysts alike) see more strength ahead.
But picking the winners among the top companies can be challenging, and investing shouldn’t be treated like gambling. The risks are simply too high:
- Meta Platforms (META) gained 172% over the past year. But from its five-year peak in Sept. 2021, it lost 75% on the way to its five-year low in Nov. 2022.
- Tesla (TSLA) gained 97% last year, but shares are down $60 from its all-time high in July 2023, when they went on to lose 32% before last October.
- Alphabet (GOOGL) gained 56% last year, but that followed a 41% loss from Nov. 2021 to Jan. 2023.
Crystal balls aren’t real and charlatan fortunetellers are about as transparent as a third coat of black paint. So rather than trying to predict 2024’s tech winners, we recommend investing in an ETF leveraged to the top performers in the sector, thereby gaining exposure to the biggest companies without you having to pick individual stocks.
1 ETF for Broad Exposure
The Invesco Nasdaq 100 ETF (QQQM) invests 90% of its capital in the 100 largest nonfinancial companies listed on the Nasdaq. The fund — like the index it mirrors — rebalances quarterly.
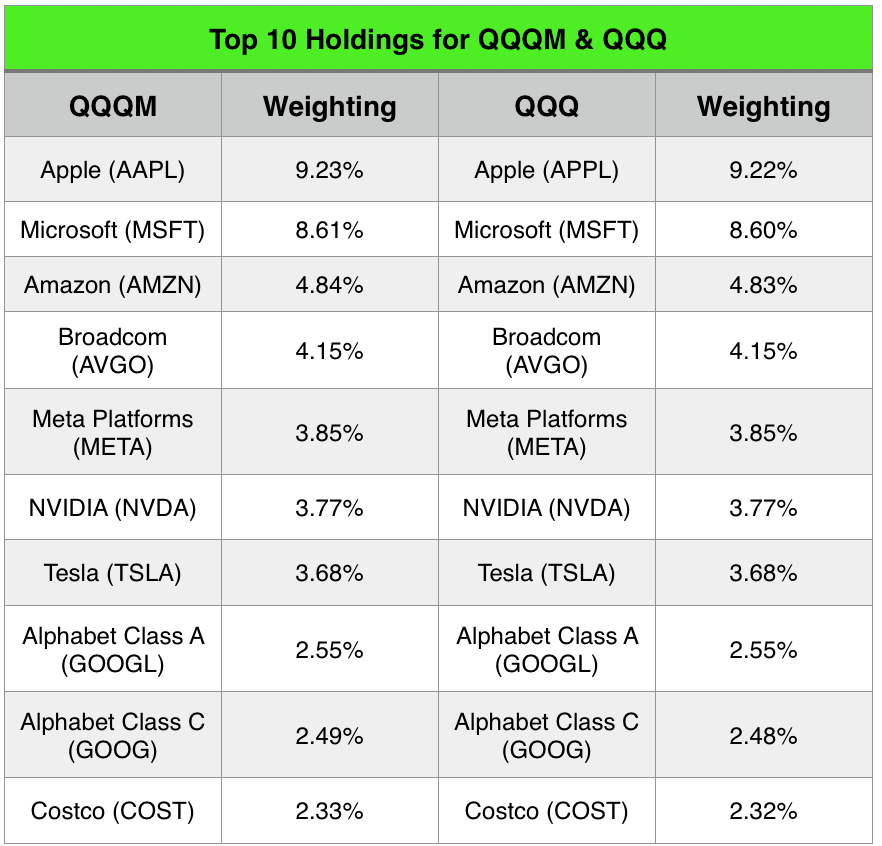
But because of the enormity of the companies constituting the Nasdaq 100, the main players typically remain the same, which is why Apple, Microsoft, Amazon, Broadcom, Meta Platforms, NVIDIA, Tesla, Alphabet and Costco are the top holdings in the ETF.
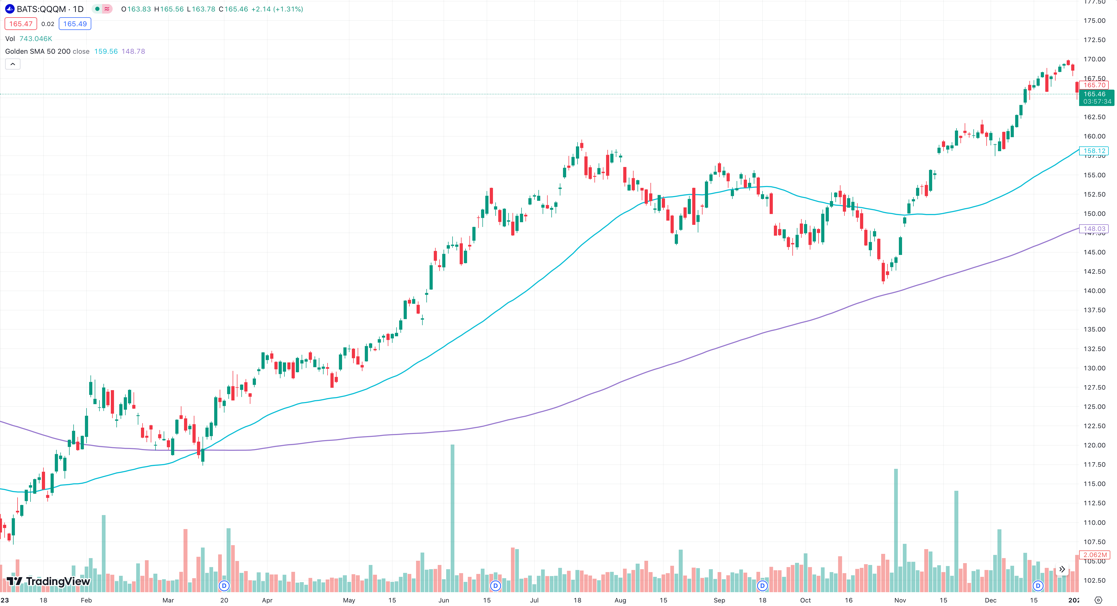
Based on analyst consensus, QQQM’s a “Buy”-rated ETF with a median one-year price target of $181.48 and a high-end price target of $225.10. Currently trading at $165/share, those price targets represent potential upside of 9%–26.6%.
Technical analysis favors the fund, with the MACD and longer-term moving averages (including the 50- and 200-day moving averages, shown in the one-year chart below in blue and purple, respectively) all indicating the ETF is a “Buy.”
Its fundamentals are sound, too. QQQM holds a healthy forward P/E ratio of 25, down from 32.77 going into Q4 2023. And while many tech stocks don’t pay dividends, this ETF provides investors with a 0.65% yield, or 38 cents/share last quarter.
QQQM also outperformed its tech ETF peers last year. Compared to its 55% return, the Fidelity Nasdaq Composite ETF (ONEQ) produced 45.7% and the First Trust Nasdaq-100 WTD ETF (QQEW) netted 33.3%.
QQQM vs. QQQ
If you’re a tech or ETF investor, you’ve probably heard of the Qs. Since 1999, the Invesco QQQ Trust (QQQ) provides access to a wide range of cutting-edge Nasdaq-100 companies. You might’ve even seen one of its tech-themed commercials.
QQQM is also an Invesco fund, and despite making its debut in 2022, it has nearly identical holdings as the QQQ, which resulted in both funds locking in the same returns for shareholders in 2023:
One difference between the funds are their respective assets under management (AUM). While QQQM oversees $18 billion, QQQ has $225 billion in AUM, largely attributable to its longer tenure in the market.
But when it comes to similar ETFs, small details can make big differences. Last year in our ETF 101 issue, we explained how higher expense ratios — the fees charged to cover administrative, management and marketing expenses — can negatively impact your total returns.
That’s the principal case for QQQM over QQQ, the former of which boasts an expense ratio of 0.15% versus QQQ’s 0.2%. And while 0.05% may not seem significant, it represents a 25% difference for access to the same holdings.
Another argument in favor of QQQM over QQQ is affordability. While neither is cheap (depending on your brokerage, both may be procured as fractional shares), QQQM trades at much lower prices than QQQ and most of the holdings in both ETFs:
- QQQM: $165/share
- QQQ: $400/share
- AAPL: $185/share
- TSLA: $238/share
- META: $353/share
- MSFT: $370/share
- NVIDIA: $510/share
- COST: $657/share
- AVGO: $1,074/share
So while you’re gaining nearly identical exposure to QQQ’s holdings, QQQM costs $235 less per share, has a 25% lower expense ratio and provides access to the same Big Tech companies.
TL;DR
Last year’s tech rally should continue throughout 2024 bolstered by industry consolidation and developments in AI. To invest in the sector while decreasing your risk, consider an ETF like QQQM, which has a lower expense ratio and better performance than its peers while providing you with safety through diversification.
