
This ETF Mirrors Millennial Spending Habits
Millennials have taken a lot of heat over the years. Much of that criticism has come from out-of-touch mainstream media and baby boomers — two groups that continuously overlook the fact that the reason an entire generation can’t afford homes isn’t because they spend too much on lattes and avocado toast … but because they were left with the economic fallout of a rapidly decaying corporatocracy.
The criticism hasn’t been limited to millennials’ housing situation, either. The demographic has been blamed for “killing” everything from moth balls and paper napkins to mayonnaise and diamonds.
Additionally, as we wrote last week in our student loan forgiveness primer, the opportunities for advancement through higher education aren’t what they used to be.
Millennials are the most educated group in American history, and college graduates make on average $1.2 million more over their lifetimes than their non-degree-holding counterparts. But getting there can now entail assuming life-altering debt, something older generations didn’t have to concern themselves with.
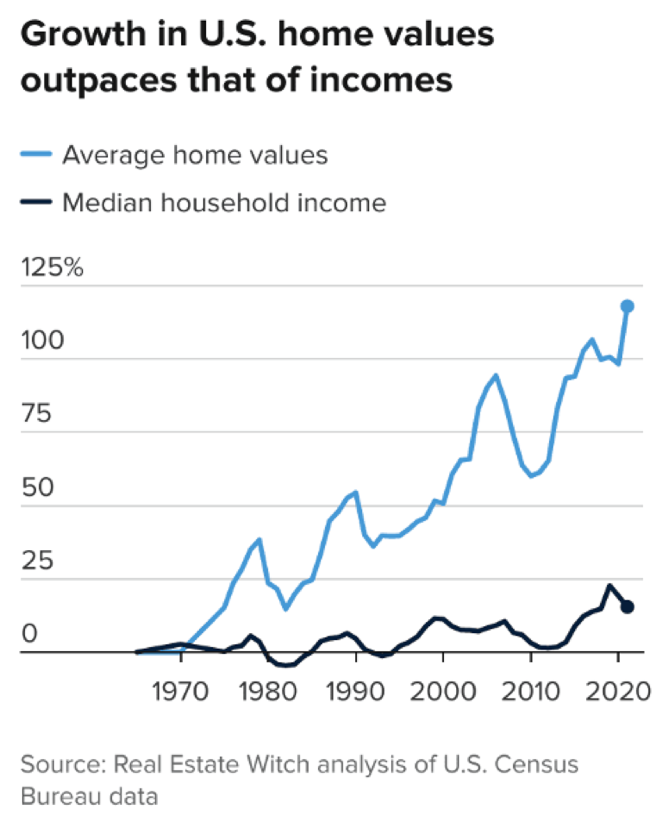
Older generations also paid far less for homes as a percentage of their income. Childrearing was similarly more affordable. And paying college tuition on minimum wage was actually possible. So it’s unsurprising that many millennials — and some economists for that matter — feel the American Dream is dead.
This week’s issue, however, isn’t a treatise on generational wealth disparities resulting from the increasing grip of the American plutocracy. We’ll save that for another day.
Instead, we’re going to focus on the collective purchasing power of America’s largest cohort … and one ETF that’s produced eye-catching returns based on millennials’ consumer behavior.
Lemons & Lemonade
With only about half of millennials owning a home, what — besides the aforementioned lattes and avocado toast — are they spending their money on? For a better idea, consider the following:
- They hate cable; 64% use subscription streaming services.
- They love social media; 88% frequent those platforms.
- They travel more than any other generation, averaging 35 days/year.
- They prefer shopping online rather than in brick-and-mortar stores; 73% say they’ll match or exceed what they spent on e-commerce last year.
- And when they do shop in-store, 61% prefer Big Box retailers and buying in bulk.
Those are only U.S. statistics. Globally, millennials account for a population of 1.8 billion that spends $2.5 trillion annually — a figure that’s expected to grow to $4 trillion by 2030.
And while the media continues to paint the generation as feckless and infantile with poor money management skills, the reality is that they’re entering middle age, saving and investing more than those before them and are holding more influence over the economy than any other cohort.
So how does this translate into an investment opportunity? One ETF seems to have figured it out.
Tracking Millennial Consumption
The Global X Millennial Consumer ETF (MILN) “invests in companies that have a high likelihood of benefitting from the rising spending power and unique preferences of the U.S. Millennial generation.”
According to the fund, this cohort has most of their prime earning years ahead, and “companies that cater to [them] should be well positioned for growth.”
The first thing any investor should scrutinize with an ETF is its holdings. And if you refer to the bulleted list above, there’s a direct correlation to the following positions in MILN:
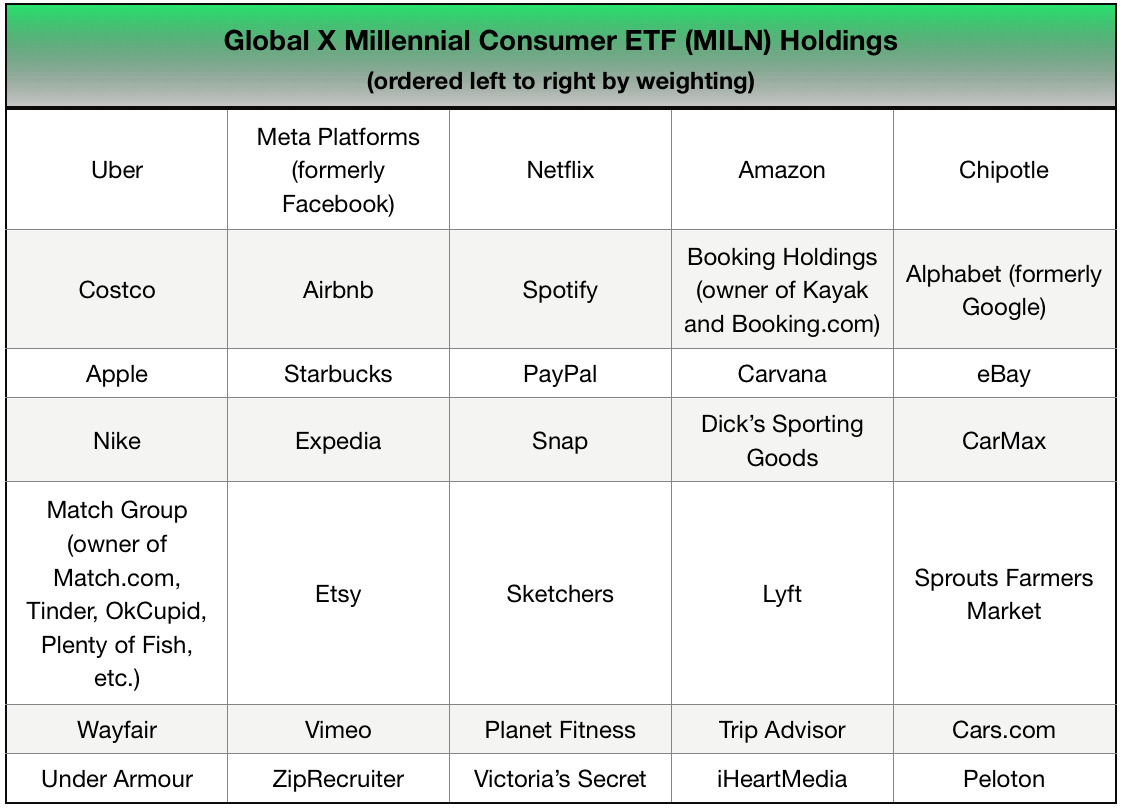
That portfolio is so millennial, it hasn’t answered a phone call since 2002. But is this ETF a gimmick? Or does it actually perform well? Let’s take a look …
Digging Deeper
At first glance, MILN’s 0.50% expense ratio seems a bit high. Passive investors might be better off with an S&P 500 index with lower fees (like this one we wrote about last month).
However, its expense ratio is nearly offset by the 0.31% dividend yield it pays semiannually. And its performance more than makes up for the rest.
So far this year, MILN’s up 10%. Over the past year, it gained 35% and outperformed the S&P 500. Since its inception in May 2016, it’s climbed 157%.
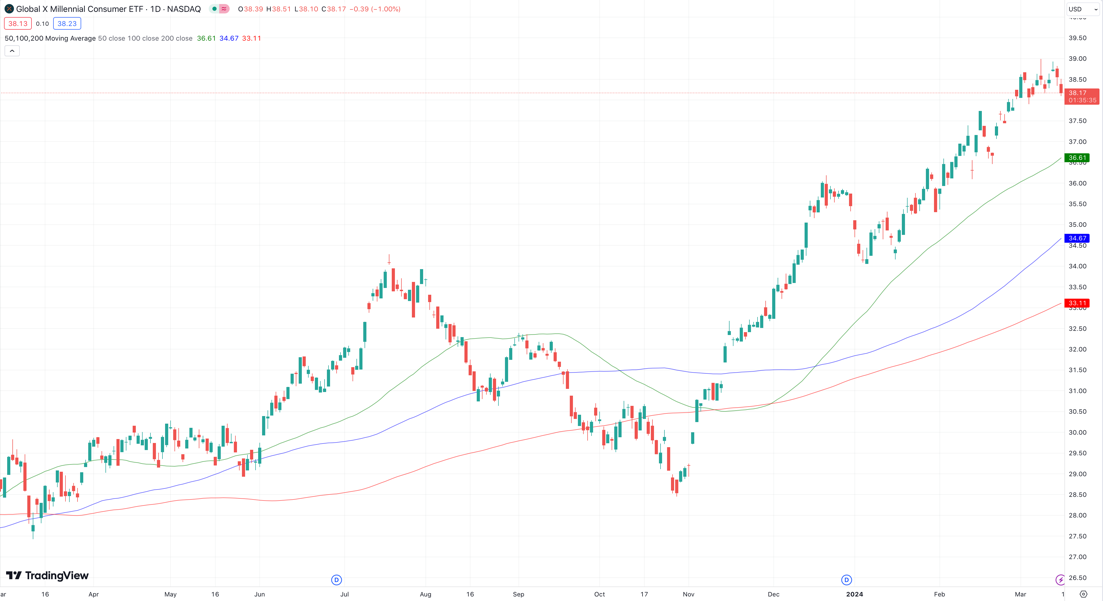
Since last December, the fund has traded above its 50-, 100- and 200-day moving averages, indicating short-, medium- and long-term bullishness, which contribute to its high-end one-year price target of $48.80 (shares are currently trading around $38).
If you’re looking for an ETF with steady growth potential and lower risk, MILN provides exposure to a basket of companies that fit the bill. Its holdings provide broad exposure, from tech and travel to health, financial services and entertainment.
